So ok, so far we’ve discussed that the world is analogue, and the computer is digital, but, you say… can we get back to pictures?
Well, the fact is that image data is not only analogue in nature, it has many levels of complexity. With temperature, data can be measured in a linear fashion as it has only one dimension of variance: cold to hot. Applying numerical values to temperature, therefore, seems logical: low to high. An image, on the other hand, has little that easily lends itself to numeric representation. Nonetheless, the way that images are stored digitally is still based on numerically translated sampling and measuring techniques, just taken on to another level.
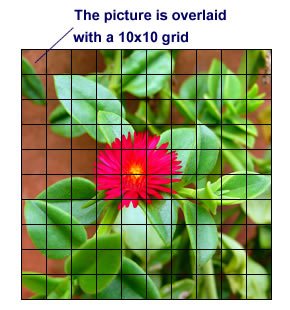
Let’s take a square image, like this one for instance.

We’ll overlay it with a grid that is 10×10. Notice there is no unit of measurement used at this point, because it isn’t necessary – yet. Each square in the grid we can say is a picture element, but they’re referred to as pixel for short.

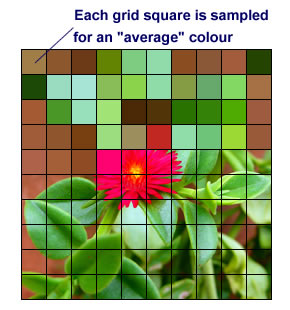
Each pixel contains a small area of our image, and forms the basis of digital image representation. Starting at the top-left pixel, we calculate an average of the colour within it.

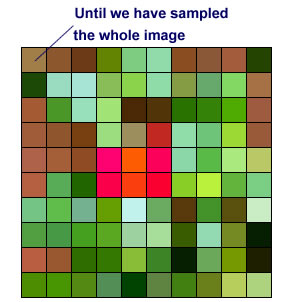
We continue through each pixel left to right, top to bottom, until every pixel’s colour has been sampled.
Clearly, if only for simplicity’s sake, we’ve used a very low resolution for sampling our image. On the next page we’ll discuss some of the implications of sample resolutions for digital images.
not very good